
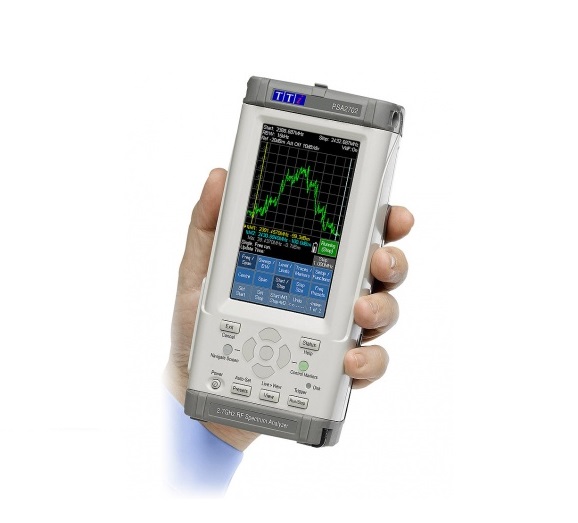
Aim TTI PSA1302USC Handheld Spectrum Analyser + SC Kit and U01 (1.3GHz)
FREQUENCY MEASUREMENT
Frequency Span
Frequency Range: 1 MHz to 1300 MHz (PSA1302)
1 MHz to 2700 MHz (PSA2702)
Setting Modes: Centre frequency plus Span,
or Start plus Stop frequencies
Maximum Span: 1299 MHz (PSA1302)
2699 MHz (PSA2702)
Minimum Span: 270 kHz, or Zero Span with demodulation
Set. Resolution: 1 kHz at any frequency
Setting Accuracy: Reference Frequency Accuracy for Start,
Stop & Centre (Zero-Span) frequencies
Reference Frequency Accuracy
Initial Accuracy: Better than ± 10 ppm at 20 oC
Stability: Better than ± 10 ppm over 10 oC to 30 oC
Ageing: Better than ± 3 ppm per year
Phase Noise
Phase Noise: Phase noise at 100kHz offset at 500MHz
typically -90dBc/Hz
Resolution Bandwidth
RBW: Selectable 1 MHz, 280 kHz, or 15 kHz
Video Filtering: Selectable independently of RBW setting
Markers
No. of Markers: One, Two (or None)
Resolution: 0.1 kHz at all frequencies
Marker Accuracy: 1/270th of Span ± 0.1kHz plus reference frequency accuracy.
Readout: The frequencies at the marker points and
the frequency difference are displayed
AMPLITUDE MEASUREMENT
Amplitude Range
Units: Selectable as dBm or dBµV
Display Range: 85 dB from reference level
Magnification: x2, x5 or x10
Reference Level: Selectable as -20 dBm or 0 dBm (87 dBµV or 107 dBµV)
Amplitude Accuracy
Calibration Level
Accuracy: Better than ± 1 dB at 10dB below ref.
level @ 50MHz (20oC ± 5oC)
Flatness: Better than ± 1.5 dB over the range
1 MHz to 1300 MHz (PSA1302)
1 MHz to 2700 MHz (PSA2702)
Linearity: Better than ± 1 dB over 50dB from the
reference level
Noise Floor: Better than -93 dBm average displayed
noise floor (typically -96 dBm)
(reference level = -20 dBm, RBW = 15 kHz)
Distortion and Spurii
3rd Order Intermodulation:
< –60dBc for two signals at 10dB below reference level,
(500MHz and 502MHz)
Harmonic:
< –60dBc at 10dB below reference level (100MHz)
1st & 2nd Image:
<– 55dBc, typically <– 60dBc
Residual Spurii:
better than 3dB above noise floor
Markers
No. of Markers: One, Two (or None)
Resolution: 0.1 dB
Readout: The level at the marker points and
difference are displayed.
SIGNAL INPUT
Input Connector: SMA connector, 50 W
VSWR: 1.5 : 1 typical
Maximum Level: + 20 dBm, (127 dBµV); +/-50V DC
Get exclusive volume discounts, bulk pricing updates, and new product alerts delivered directly to your inbox.
By subscribing, you agree to our Terms of Service and Privacy Policy.
Direct access to our certified experts